
Past is prologue
A 45 yo M presents to the ER with pleuritic chest pain. A chest XR showed white-out of the left hemithorax. Chest tube placed with return of 1.6 L of blood. A chest CT showed a large left hemothorax, with evidence of active bleeding adjacent to the left 5th rib. Patient taken to IR where a fourth order branch of the left subclavian artery (branch of the left subscapular artery) seen feeding a small aneurysm corresponding to abnormality seen on CT. Gelfoam embolization performed.
So far so good, fairly common to see an intercostal aneurym needing embolization. But there was no trauma! So why the aneurysm? To understand, we need to go to the beginning.
The story starts 9 months prior, when patient had a massive PE. Was anti-coagulated, eventually put on warfarin, but with poor compliance. About 2 months after the saddle PE, he had chest pain, and a CXR and CT showed a pulmonary infarct in left upper lobe. Switched to xarelto.
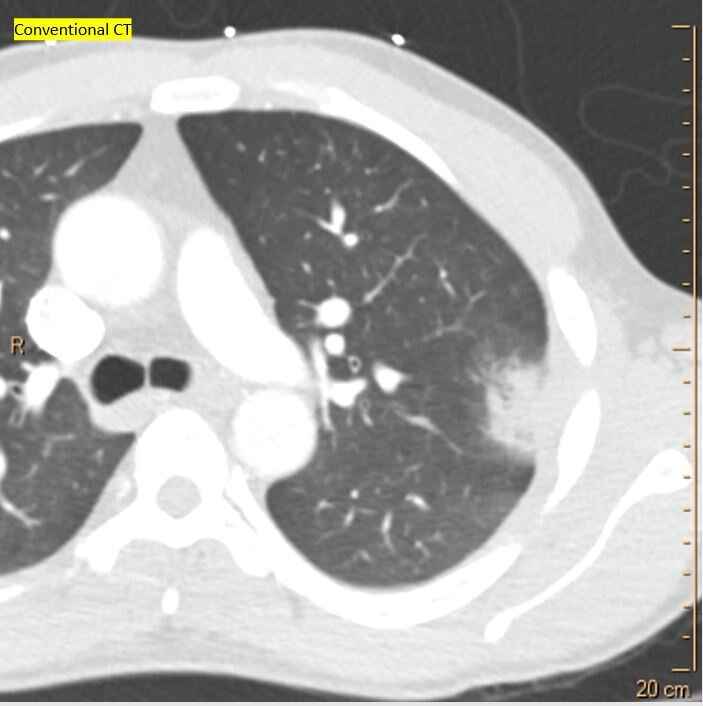
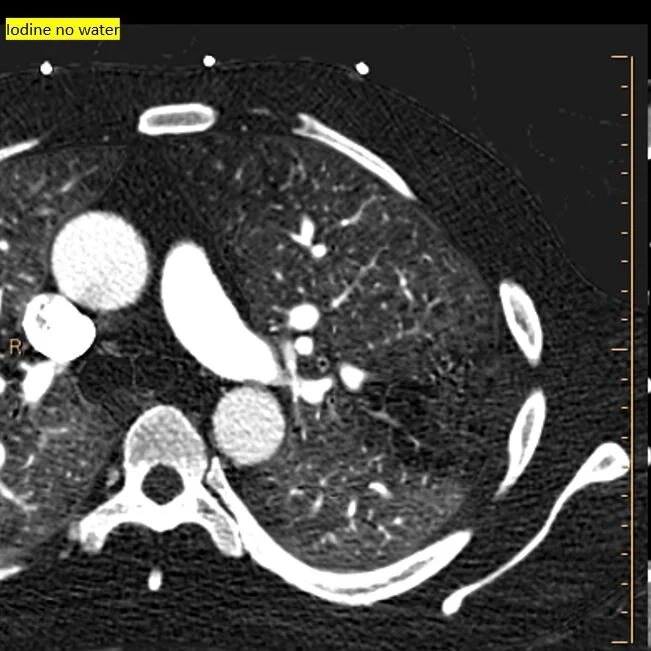
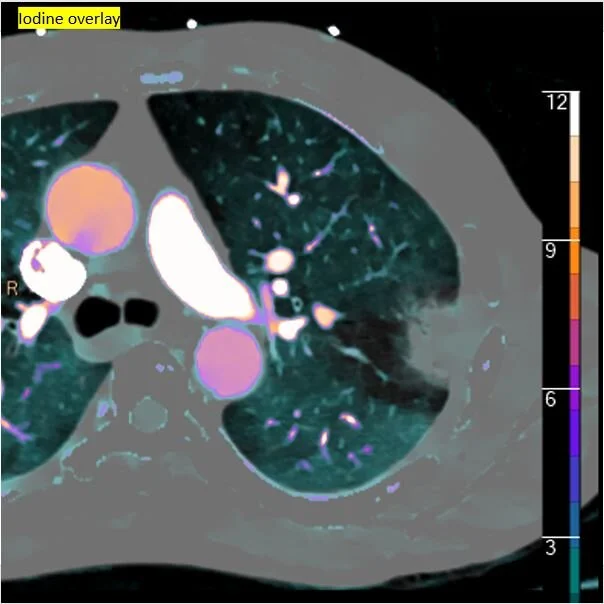
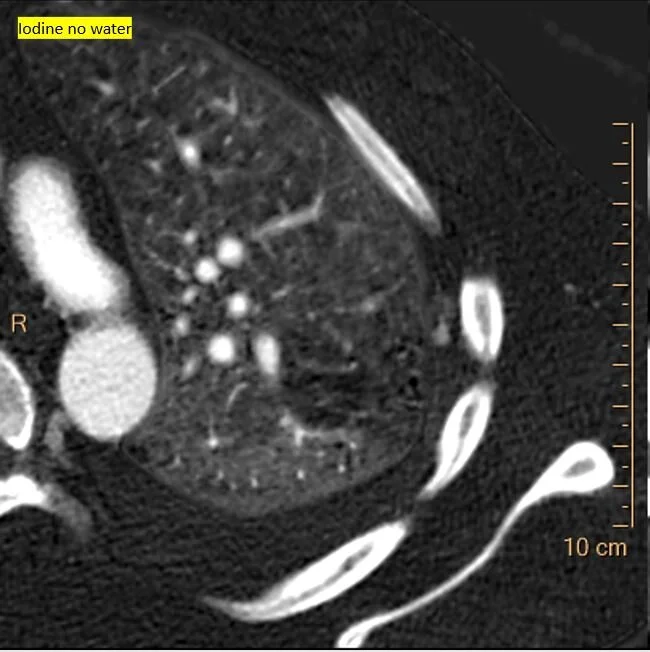
A few days prior to the massive hemothorax, he presented with pleuritic chest pain. CXR showed a small pleural effusion. On conventional CT, there is a small area of pleural thickening in the left upper lobe, near the previous infarct. On Spectral CT, a small aneurysm is clearly visible on the 40 keV image and iodine map. This is what bled a few days later.
Enlarged systemic artery collaterals have been well described. The fact that the aneurysm occurred exactly in the location of the previous infarct is consistent with the systemic collateral being aneurysmal and causing the hemothorax.
Using spectral CT brings out the story!

CXR with white out on L. Notice shift of mediastinum to the R, c/w a large pleural effusion.
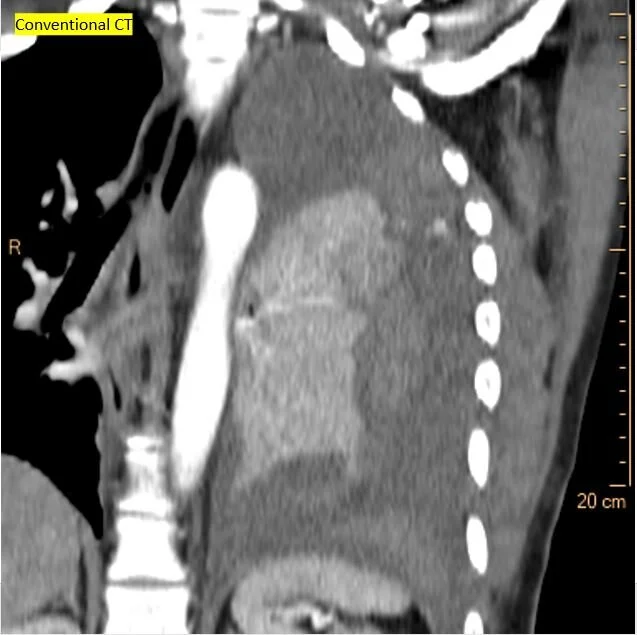
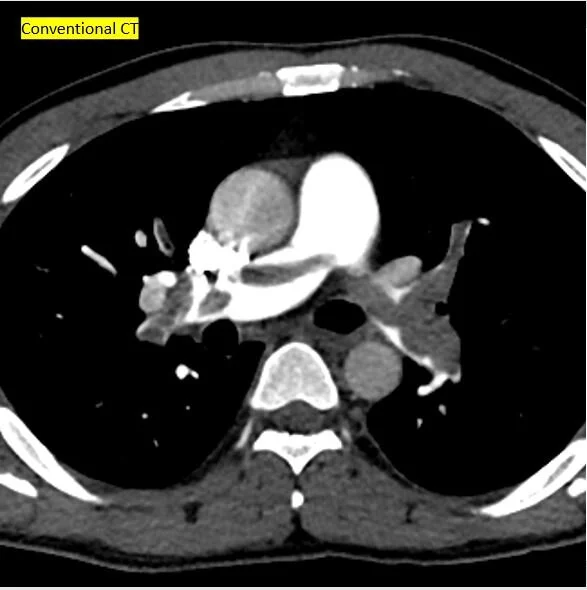
Conventional CT shows large left hemothorax
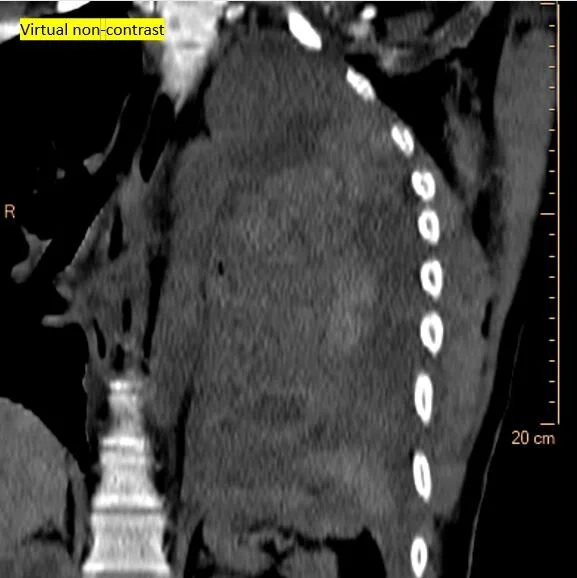
Virtual non-contrast shows clots surrounding the left lung
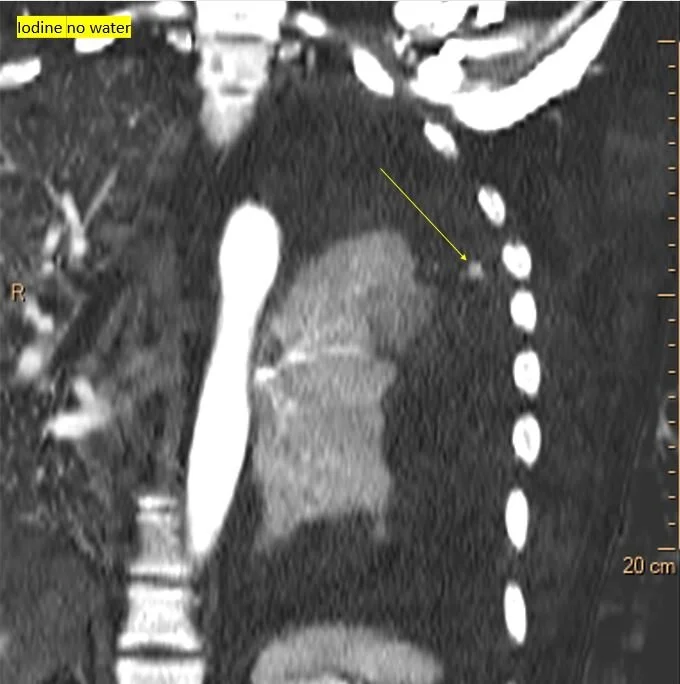
Iodine map shows small focus of active bleed (yellow arrow)
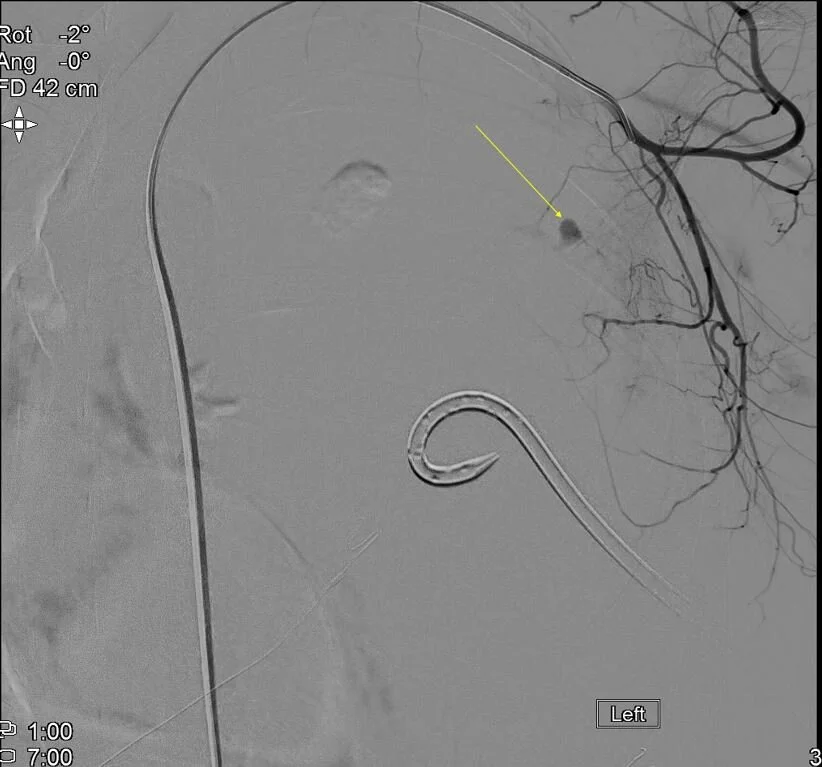
Angiogram confirms bleeding aneurysm. This was embolized.
Going back in time: Conventional CT 9 months prior shows saddle PE

A couple of months later: CXR shows nice infarct.
CT confirms the infarct.
Iodine map shows infarct is the core of the large perfusion abnormality
Iodine overlay: The infarct is a lot smaller than the perfusion abnormality

Recent CXR: All that is left is a bit of pleural thickening where the infarct used to be. Notice trace left pleural effusion with blunting of L costophrenic angle.

Conventional CT shows pleural thickening
Iodine map shows focal nodule of uptake in the pleural thickening
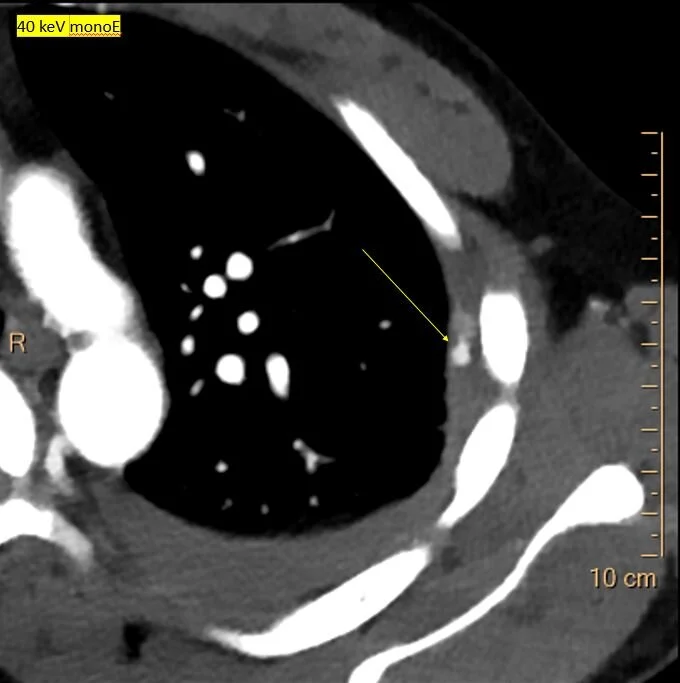
40 keV monoE: Nicely depicts the aneurysm!
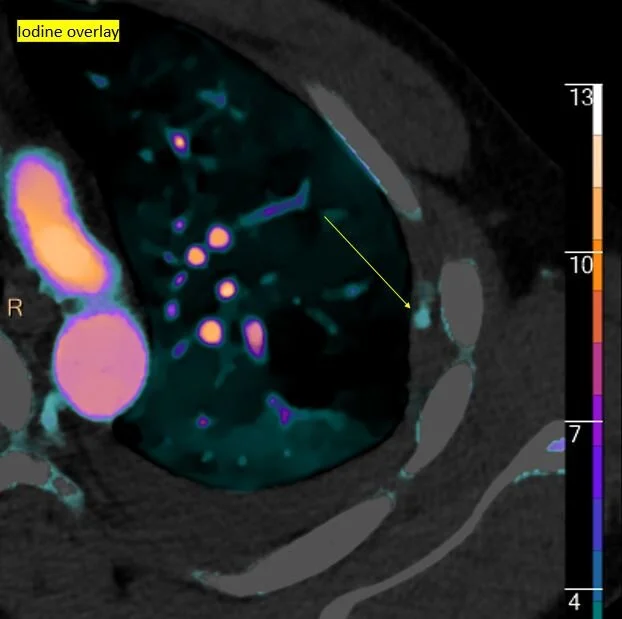
Iodine overlay confirms the finding. This is what bled a few days later.