
Two hits on one spectral scan...
35 yo F with sudden onset of abdominal pain while watching TV. Conventional CT shows right adnexal cyst, otherwise unremarkable.
On spectral analysis, obvious gallstones are visualized, confirmed on ultrasound, where there was no evidence of acute cholecystitis. It is not uncommon to find gallstones on spectral CT that are not seen on conventional images, and spectral curves nicely illustrate the reason.
The right adnexal cyst is without iodine uptake, consistent with hemorrhagic cyst. Ovarian tissue below the cyst appears enlarged, and on spectral analysis, shows absent iodine uptake. Ovarian torsion was suspected. On ultrasound, blood flow was seen in the right ovary. On radiology resident exam, the patient was highly tender over the right ovary.
So we stuck to our spectral guns, and suspected ovarian torsion. Patient was taken to the operating room.
There was no evidence of torsion. Cystic and solid lesion of the right ovary was removed, found to be a serous cystadenofibroma on pathology.
On follow-up exam, patients symptoms had resolved.
Was this a poorly perfused benign ovarian tumor? Was this intermittent torsion, which had resolved by surgery? Or can torsion be called based on spectral CT at all?
As always, we will continue to learn....

Conventional CT with normal gallbladder
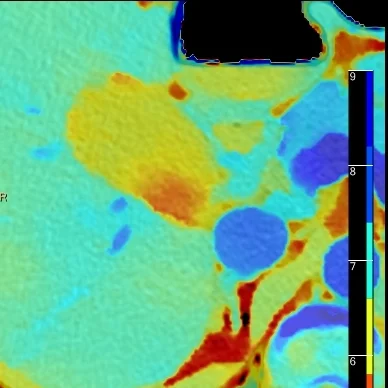
Gallstones easily seen on effective atomic number overlay image

On conventional image, attenuation of bile (magenta ROI) and gallstones (blue ROI) is nearly the same. No wonder they are invisible.

Spectral plot is very enlightening: at 70 kev (yellow line) , attenuation curves of bile and gallstones intersect, so they cannot be seen. At 40 keV (left), stones are hypodense relative to bile, and at 200keV (right), they are hypredense. This is obvious on the respective images.
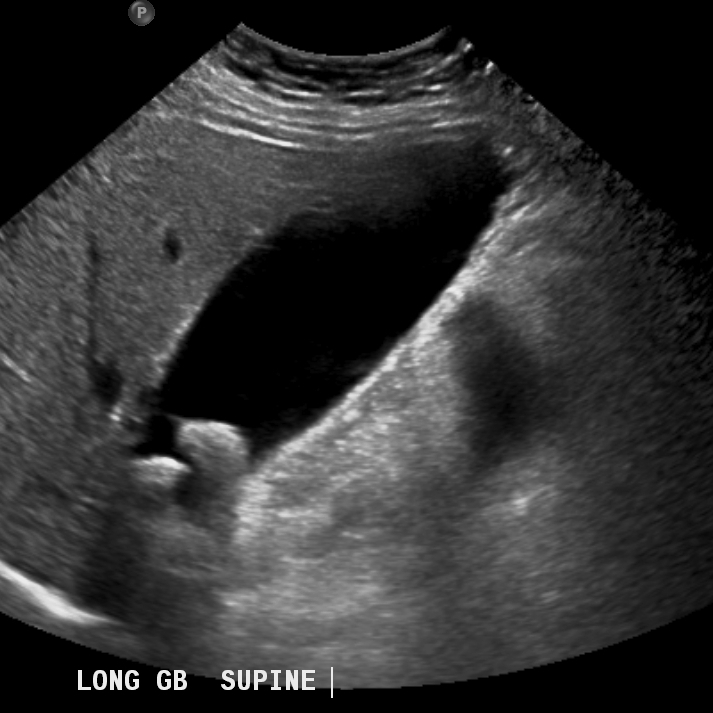
Ultrasound confirms gallstones, but no sign of acute cholecystitis
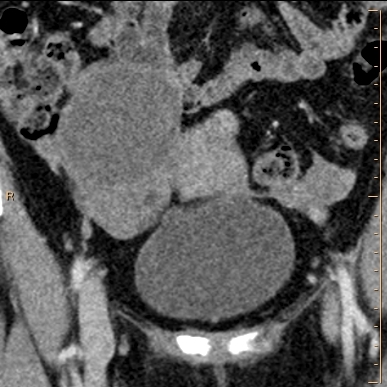
Conventional coronal CT through pelvis shows right ovarian cyst, otherwise unrerkanle

Virtual non-contrast image shows ovarian parenchyma below cyst is somewhat hyperdense
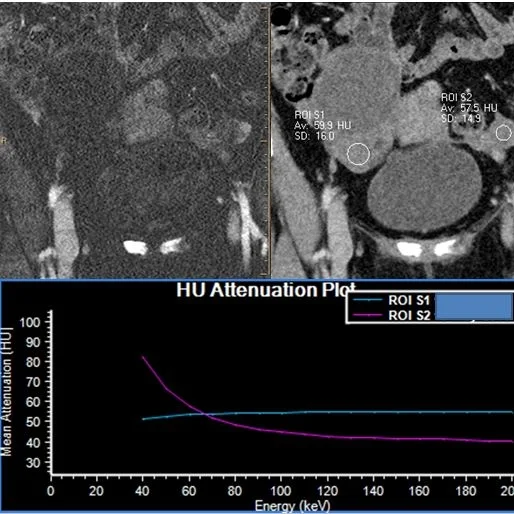
Iodine map shows no uptake in parenchyma below right ovarian cyst. Spectral curves confirm suspicion: magenta curve (ROI in left ovary) shows rise on low keV, consistent with iodine uptake. Blue curve (ROI in right ovarian parenchyma) remains flat, and actually decreases a bit on lower keV, consistent with lack of iodine.

Iodine overlay image shows absent iodine uptake.