
It's all about confidence
80 year old F presents to the ED with chest pain. EKG is negative, and she had a negative coronary angiogram a few years ago. The ER doc is worried about aortic pathology.
Unfortunately, patient has a known allergy to iodinated contrast. We use a “rapid” premedication protocol with a single dose of IV steroids, and the CT scan is performed. Patient did not have a contrast reaction, by the way.
As I look at the images, I notice a small area of hypoenhancement in the lateral wall of the left ventricle. I am not entirely sure if this is real, so I look at Spectral CT images. And boy, were they convincing!
The attenuation of the hypo-enhancing area is about 55 HU on conventional images, and normal myocardium is about 132 HU, giving a difference of about 77 HU (there is a standard deviation). Now look at 40 keV image: the attenuation difference is almost 300 HU, with nearly the same amount of noise. On the iodine map, the area in question has almost no iodine uptake, where normal myocardium has about 3.5 mg/ml of iodine. This is ischemia in the circumflex territory, which I tell the ER.
Patient did eventually go to cath lab, where an occluded OM was stented. For more on this case, please visit Dr Smith’s EKG blog (he is still as kind today as he was years ago, when I was an intern rotating in the ER).
The trick here really is having access to spectral CT. We were calling these MI’s before on chest CT, but the confidence level was not high (I would tell the ER that I was right only 60-70% of the time). But now, I feel much more comfortable with these diagnoses.
By the way, I got this message from my cardiologist “Should not have doubted you! If you'd like us to call you for all suspected OM-related NSTEMI in the future we'll be happy to!”
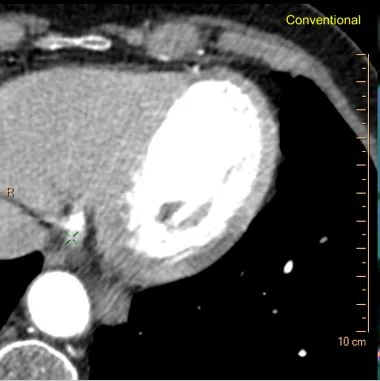
Conventional CT: Do you see the MI?
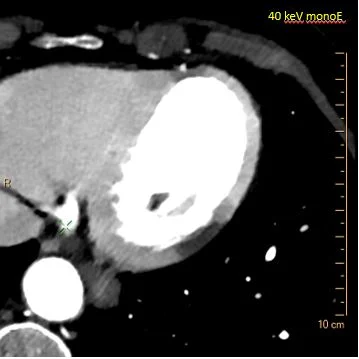
40 keV image: How can anyone miss the MI?
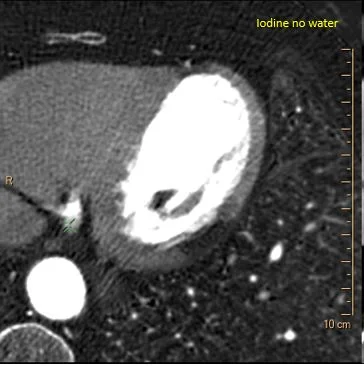
Iodine map: Stands out.
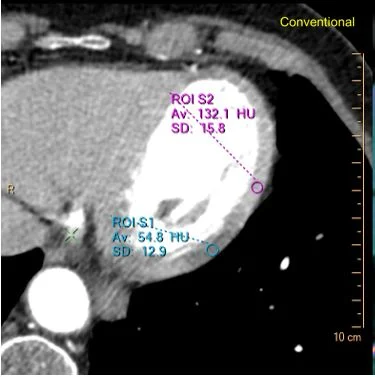
Now some numbers. Notice the attenuation difference between MI and normal perfused myocardium on conventional scan.
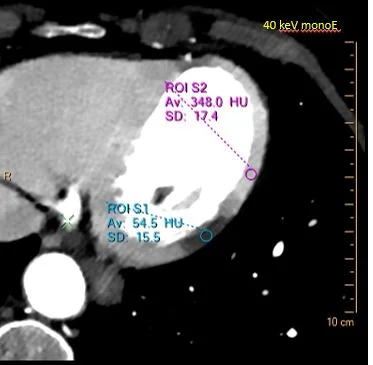
40 keV: Attenuation difference nearly quadrupled!
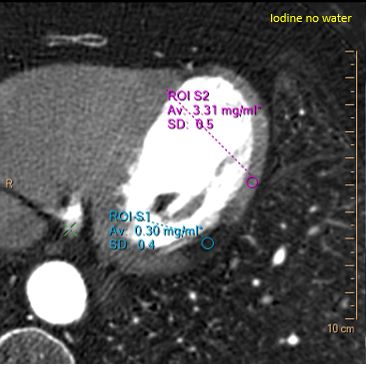
Iodine map shows no uptake on measurement.

Spectral curves: yellow dashed line shows difference in attenuation on conventional imaging, and red dashed line shows the difference on 40 keV image.
Now, why would you not want to use spectral CT?