
Satisfaction of search
Young female presents with abdominal pain. Known issues with alcohol. Routine lab tests show elevated LFT’s, with a markedly elevated bilirubin. Routine CT scan of the abdomen ordered from the ER shows hepatic steatosis (surprise!) and ascites. Spectral CT images show a very heterogeneous liver on iodine map and low KeV images, consistent with steatohepatitis. This is important, as it can be very painful, and the heterogeneous enhancement differentiates it from a simple fatty liver. The heterogeneous enhancement can be best appreciated on dynamic MR, but on a routine portal venous CT, you need spectral analysis to appreciate it.
But there is more…
There is a filling defect in the cecum. This shows iodine uptake (have to be careful, as stool may show artifactual iodine uptake), and seems to have a stalk. A cecal mass was suspected, and confirmed on colonoscopy, where histology showed a tubular adenoma.
Patient did well on follow up after cessation of ethanol intake. This case illustrates the importance of something I learned on my first day in radiology residency: satisfaction of search. You got to keep looking, spectral CT will help you find!

Severe direct hyperbilirubinemia (blue curve, magenta is total bilirubin). Bilirubin dropped to normal over several days.

Conventional CT: Fatty liver.

40 keV monoE: Heterogeneous liver, now see the cecal mass pop into view!
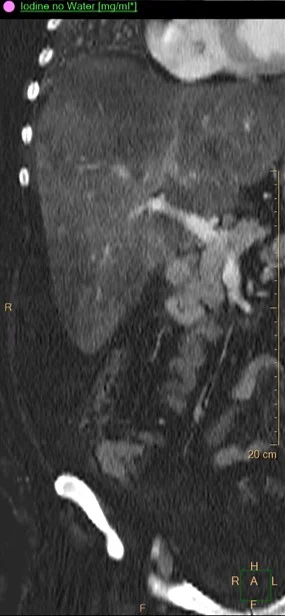
Iodine map: same as above. Notice the stalk.

Iodine overlay depicts findings well.
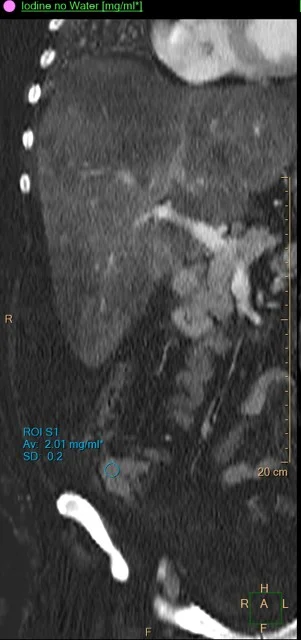
Iodine uptake in cecal mass.

Colonoscopy: Cecal tubular adenoma.